Get Started in Data+Design Dashboard
The dashboard is a web-based application that runs using the latest web browser technology. It can be used on any operating system provided that the operating system is equipped with a compatible web browser. Before you can use the dashboard, you need to request for an account from the tech administrator. You will be provided with a username, temporary password, and instructions to access the dashboard.
In order to log in to the dashboard, open a compatible web browser. Browse to the URL where the Data+Design is hosted. If you are unsure of the URL where the dashboard is hosted, please contact your administrator. Enter your username and password and click log in.
Dashboard basics
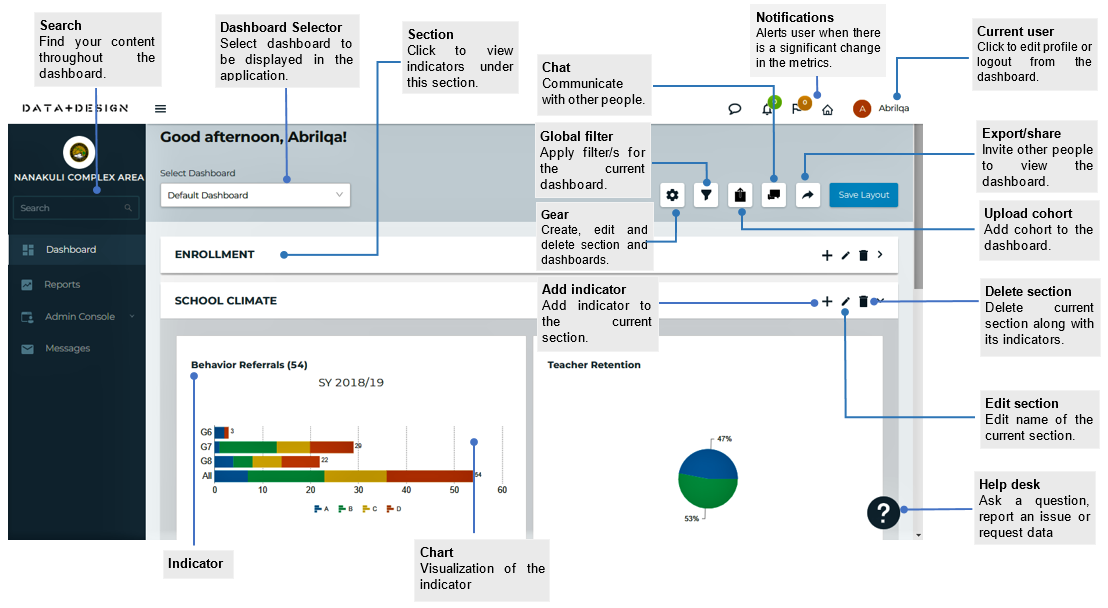
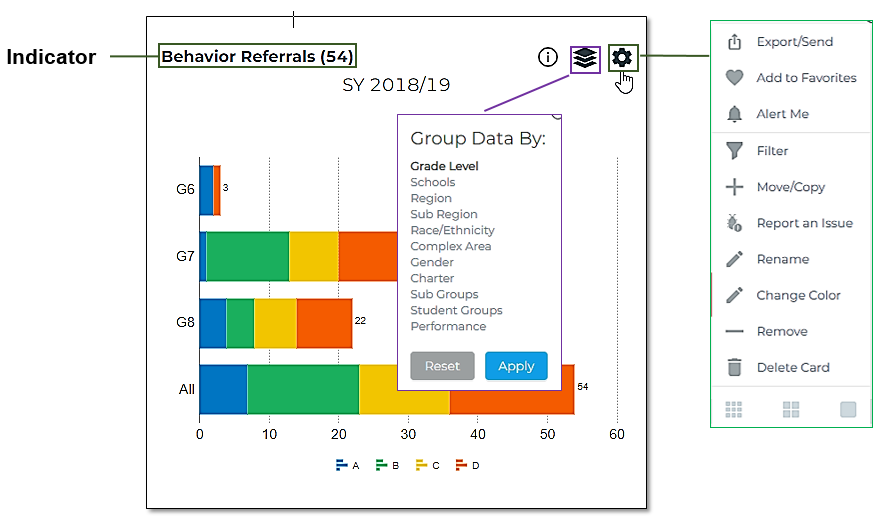
The dashboard provides a snapshot overview of your data. You can customize the dashboard to meet your specific needs and preferences by drilling down and slicing data with a simple mouse-driven interface. It has filtering capabilities to limit the data being displayed in the report based upon specified parameters. You can create customized groups of tiles that when selected display the specified tiles as a pre-configured grouping based upon your specific needs or preferences.
The dashboard also has the capability to export and share the collected data for the reports in various formats (email, print, spreadsheet, CSV, PowerPoint, and PDF). You can also create a customized schedule for sending reports via email to specified recipient(s).